Financials

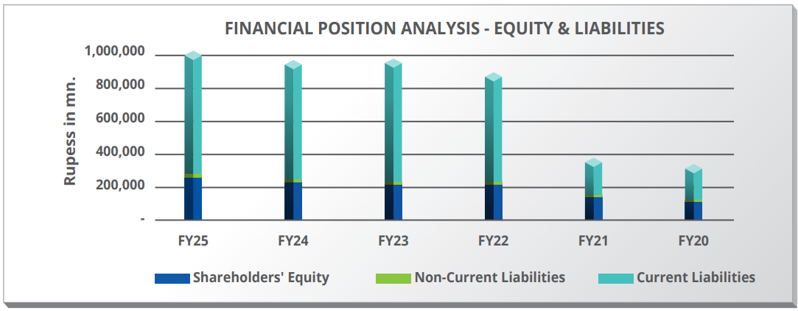
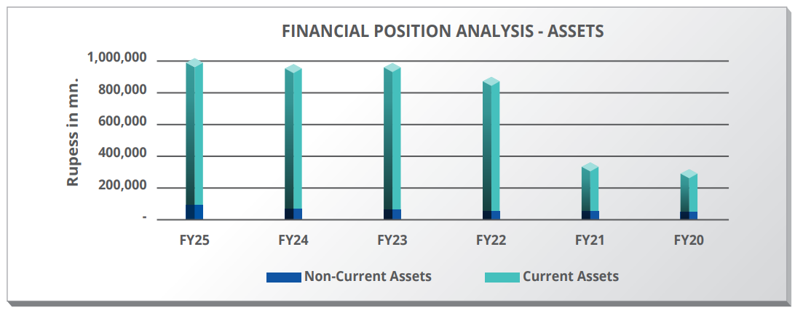
    • Analysis of Financial Position

      Analysis of Financial Position

      For the year ended June 30, 2022

      Rupees In Millions
      2022 2021 2020 2019 2018 2017
      Shareholders' equity 215,649 139,978 113,061 119,181 110,452 102,850
      Non-current assets 53,624 51,297 49,611 32,854 24,561 23,883
      Current assets 845,830 327,962 293,261 384,225 378,001 368,560
      Non-current liabilities 16,548 12,239 12,461 7,528 5,165 8,090
      Current liabilities 667,258 227,043 217,350 290,371 286,945 281,504

      Analysis of Financial Position

      As of June 30, 2022, variation as compared to June 30, 2021 is as follows:

      • Shareholders' equity increased by 54.1% primarily due to profit retained during the year.

      • Non-current assets increased by 4.5% mainly due to additions in property, plant & equipment and increase in deferred tax asset due to increase in future tax rate on account of imposition of super tax.

      • Current assets increased by 157.9% primarily due to increase in stock in trade (mainly due to price variance) and trade debts.

      • Increase in non-current liabilities by 35.2% mainly due to increase in retirement & other service benefits and lease liability.

      • Increase in current liabilities by 193.9% due to increase in trade and other payables mainly on account of increase in cost of purchase and increase in short term borrowings to finance working capital needs.

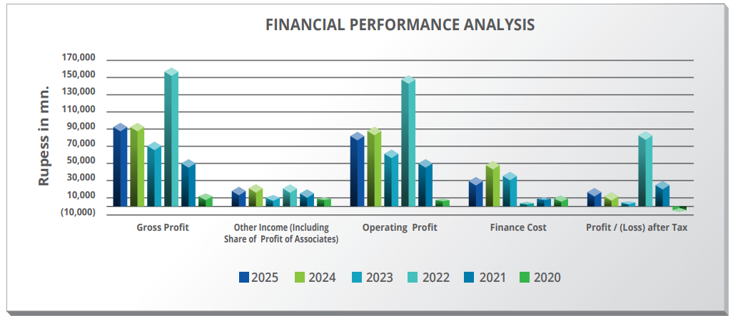
    • Analysis of Financial Performance

      Analysis of Financial Performance

      For the year ended June 30, 2022

      Rupees In Millions
      2022 2021 2020 2019 2018 2017
      Gross sales 2,697,061 1,424,249 1,302,037 1,340,978 1,312,090 1,096,543
      Net sales 2,451,581 1,204,247 1,108,358 1,154,298 1,063,744 878,147
      Gross profit 160,995 54,609 12,227 36,017 39,636 37,136
      Other income (including share of profit of associates) 25,507 19,408 10,755 7,559 7,911 11,751
      Marketing & Administrative Expenses 16,812 14,890 14,638 12,414 11,929 11,238
      Other expenses 17,114 4,829 51 4,699 3,334 2,378
      Operating profit 151,882 53,717 7,749 26,257 31,870 34,662
      Finance cost 4,721 10,242 13,427 8,987 5,123 5,923
      Profit / (Loss) before tax 147,855 44,056 (5,134) 17,477 27,160 29,347
      Profit / (Loss) after tax 86,223 29,139 (6,466) 10,587 15,461 18,226
      Earning before Interest, Taxes, Depreciation & Amortization (EBITDA) 154,819 56,053 9,907 27,591 33,357 36,322

      Analysis

      In FY 2022, company has reported profit after tax of Rs. 86.22 bn. primarily on account of following elements:

      • Increase in gross profit by 194.8% on account of higher sales volumes of white oil and black oil products due to rise in industry demand and focused sales strategies adopted by PSO. Gross profit also increased due to favourable pricing conditions on account of rise in international oil prices.

      • Increase in other income by 31.4% due to receipt of higher late payment surcharge and pipeline income.

      • Decline in finance cost by 53.9 % mainly due to to less reliance on borrowings which is more expensive and less refinery interest.

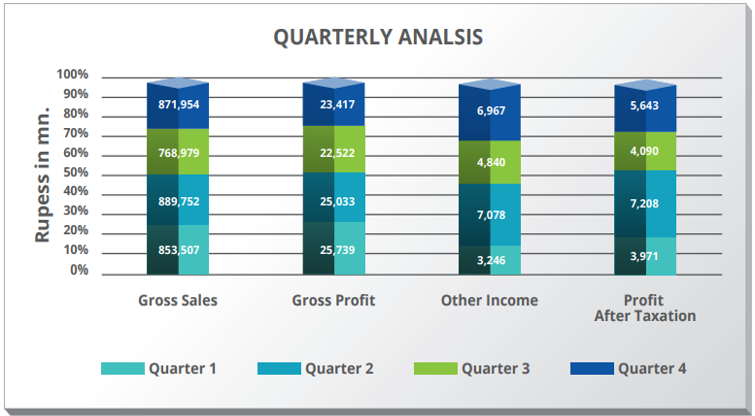
    • Analysis of Variation In Results Reported In Interim Reports

      Analysis of Variation In Results Reported In Interim Reports

      For the year ended June 30, 2022

      Rupees In Millions
      Q1 Q2 Q3 Q4 FY 2022
      Gross sales 536,685 580,252 610,896 969,228 2,697,061
      Gross profit 22,054 26,663 43,909 68,369 160,995
      Other income 1,786 8,921 11,620 2,486 24,813
      Operating cost (5,525) (5,560) (8,316) (14,526) (33,927)
      Finance cost (626) (785) (1,271) (2,039) (4,721)
      Share of profit of associate - net of tax 113 147 299 135 694
      Profit before taxation 17,802 29,386 46,241 54,426 147,855
      Taxation (5,808) (9,191) (13,661) (32,973) (61,633)
      Profit after taxation 11,994 20,195 32,580 21,454 86,223
      • Gross Sales

        Gross sales were highest in 4th quarter due to rise in industry sales demand and sales price.

      • Gross Profit

        Gross profit was also highest in 4th quarter due to higher sales volume and favourable price regime.

      • Other income

        Other income was higher in 2nd and 3rd quarter primarily due to significant receipt of late payment surcharge income from power sector in that period.

      • Finance Cost

        Finance cost was low in the first half mainly due to lower average borrowing levels and lower mark up rates which both increased in later part of the year.

    • Summary of Cash Flow Statement

      Summary of Cash Flow Statement

      For the year ended June 30, 2022

      Rupees In Millions
      2022 2021 2020 2019 2018 2017
      Cash and cash equivalents at the beginning of the year (5,917) (881) (16,468) (7,925) (41,502) (30,274)
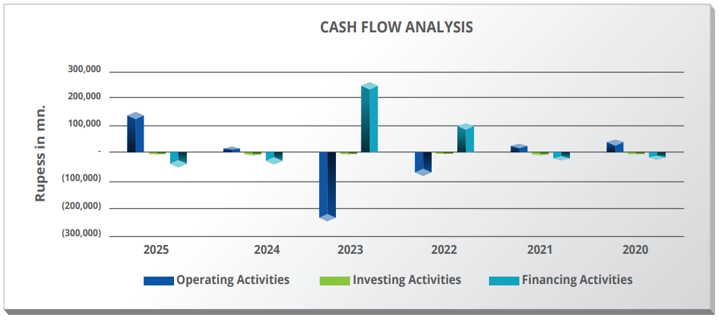
      Net Cash inflow / (outflow) from operating activities (80,974) 17,766 48,260 (9,232) 2,580 (27,965)
      Net Cash (outflow) / inflow from investing activities (2,090) (5,294) (4,843) (2,534) 45,226 3,925
      Net Cash (outflow) / inflow from financing activities 101,042 (17,507)) (27,830) 3,223 (14,229) 12,812
      17,977 (5,036) 15,587 (8,543) 33,577 (11,228)
      Cash and cash equivalents at the end of the year 12,061 (5,917) (881) (16,468) (7,925) (41,502)
      • Analysis

        The variation in cash flows as compared to FY 2021 is due to the following:

      • Operating Activities

        In FY 2022, cash flow from operating activities is negative as compared to positive cashflow from operating activities in FY 2021. The cash flows have decreased in FY 2022 primarily due to increase in stock in trade and trade debts which is partially offset by increase in trade and other payables.

      • Investing Activities

        In FY 2022, there is net cash outflow from investing activities primarily due to additions in property, plant and equipment.

      • Financing Activities

        In FY 2022, cash flow from financing activities is positive primarily due to short term loans taken during the year to meet the working capital requirements.

    • Profitability Ratios
      2022 2021 2020 2019 2018 2017
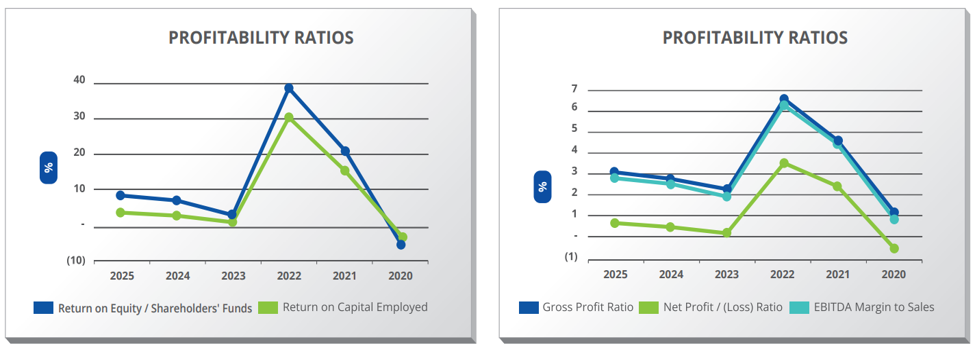
      Gross profit ratio % 6.57 4.53 1.10 3.12 3.73 4.23
      Net Profit / (Loss) ratio % 3.52 2.42 (0.58) 0.92 1.45 2.08
      EBITDA margin to sales % 6.32 4.65 0.89 2.39 3.14 4.14
      Return on shareholders' equity % 39.98 20.82 (5.72) 8.88 14.00 17.72
      Return on capital employed % 34.71 15.52 (3.19) 4.97 7.13 8.48
      Operating leverage ratio % 174.74 6,411.86 1,725.19 (211.76) (40.07) 170.92

      Analysis

      The variation in ratios as compared to FY 2021 is because of the following:

      • Gross profit and EBITDA ratios have increased as compared to last year due to improvement in gross margins on account of higher sales volume
        and favourable price regime.

      • Net profit ratio went up due to higher gross margins, increase in other income and reduction in finance cost.

      • Return on shareholders' equity and return on capital employed has increased due to increase in net profit as mentioned above.

    • Capital Structure Ratios
      2022 2021 2020 2019 2018 2017
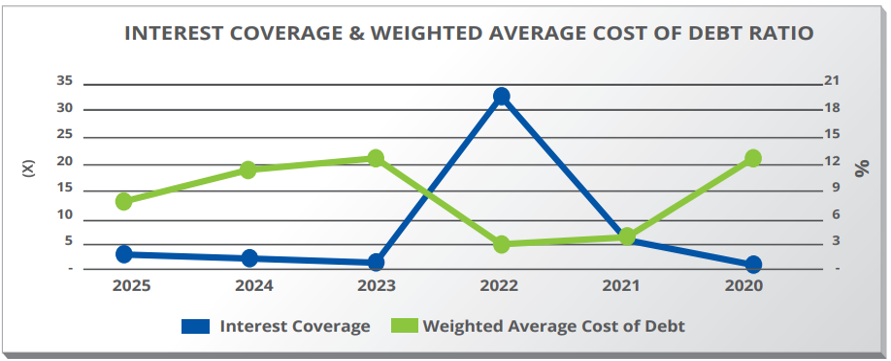
      Interest cover ratio (x) 32.32 5.30 0.62 2.94 6.30 5.95
      Net Assets per Share PKR 459.34 298.16 240.83 253.86 235.27 219.08
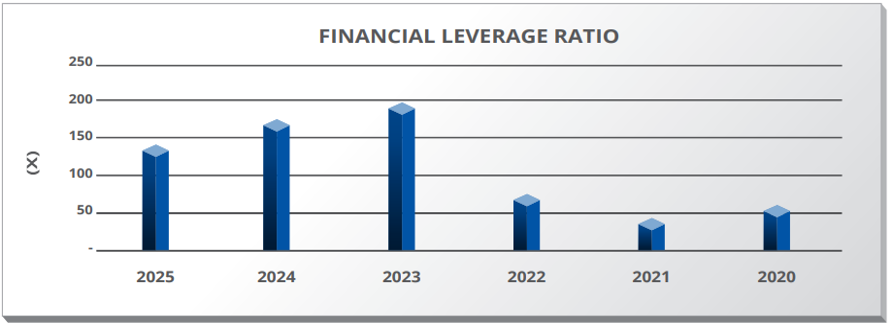
      Financial leverage ratio (x) 73.00 41.00 59.00 90.00 81.00 127.00
      Weighted average cost of debt % 3.01 3.69 13.19 18.44 4.10 4.66
      Economic value addition PKR. In Mn 73,700 10,292 (32,114) (14,962) (8,075) (4,570)

      Note: D/E ratio has not been calculated as the company has no long term debt

      Analysis

      The variation in ratios as compared to FY 2021 is because of the following:

      • Interest cover has increased due to decline in finance cost by 53.9% and increase in earning before interest and taxes by 181.0%.

      • Financial leverage has increased during the year mainly on account of greater percentage increase in short term borrowings on account of working capital needs than increase in shareholder's equity. During the year, short term borrowing has increased by Rs. 99.8 bn whereas, shareholder's equity has increased by Rs. 75.7 bn.

      • Weighted average cost of debt has decreased due to decline in borrowing rates due to robust negotiation with the banks and effective borrowing mix.

    • Liquidity Ratios

      Liquidity Ratios

      For the year ended June 30, 2022

      Rupees In Millions
      2022 2021 2020 2019 2018 2017
      Cash to current liabilities (x) 0.018 (0.026) (0.004) (0.06) (0.03) (0.15)
      Cash Flow Coverage Ratio (x) (0.12) 0.07 0.21 (0.03) 0.01 (0.10)
      Cash Flow from Operations to Sales (x) (0.03) 0.01 0.04 (0.01) 0.002 (0.03)
      Cash Flow to Capital Expenditure (x) (24.29) 3.19 16.04 4.66 1.78 20.30
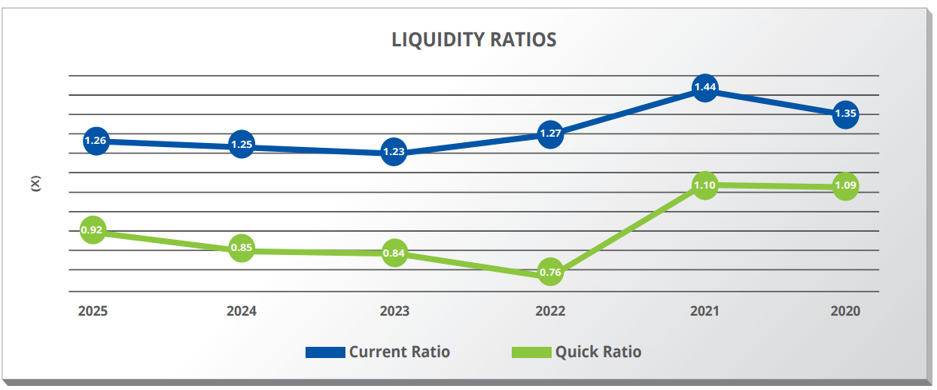
      Current Ratio (x) 1.27 1.44 1.35 1.32 1.32 1.31
      Quick Ratio (x) 0.76 1.10 1.09 1.01 1.03 1.07
      Free Cash Flows to the Firm PKR. In Mn. 23,677 42,886 66,161 (3,130) 8,063 (18,742)
      Free Cash Flows to the Equity Holders PKR. In Mn. 126,017 23,645 27,347 386 (2,464) (6,191)

      Analysis

      The variation in ratios as compared to FY 2021 is because of the following:

      • Cash to current liabilities ratio has increased due to incease in cash and cash equivalents by 304% during the year whereas the current liabilities have increased by 194%.

      • Both ratios of cash flow coverage and cash flow from operations to sales are negative due to negative cashflow from operations during the year. The cash flow from operations is negative in FY 2022 primarily due to increase in stock in trade and trade debts which is partially offset by increase in trade and other payables.

      • Current ratio has reduced slightly due to greater percentage increase in current liabilities than current assets. Current assets have increased mainly due to increase in stock in trade and trade debts and current liabilities have increased mainly due to increase in trade and other payables and short term borrowings.

      • Quick ratio has also reduced slightly due to greater percentage increase in current liabililties than increase in quick assets.

      • Decrease in cash flows to the firm is primarily due to negative working capital on account of increase in stock in trade and trade debts.

      • Increase in cash flow to equity holders is primarily due to increase in borrowing levels by 178%.

    • Investment Ratios
      2022 2021 2020 2019 2018 2017
      Earning / (Loss) per share (basic & diluted) PKR 183.7 62.1 (13.8) 22.5 32.9 38.8
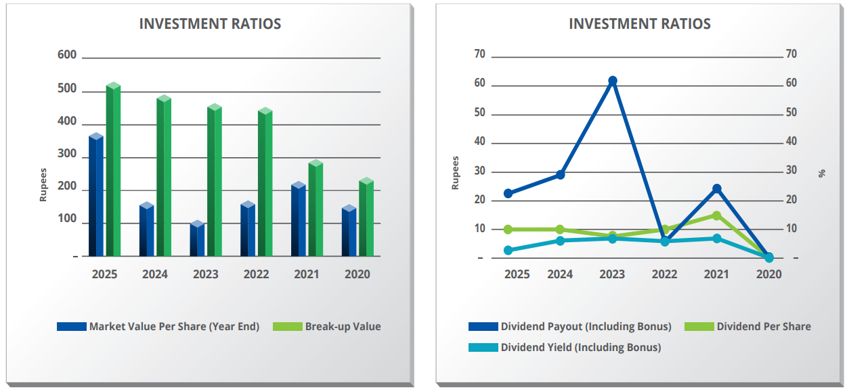
      Market value per share (Year End) PKR 171.8 224.3 158.2 169.6 318.3 387.4
      Highest price PKR 231.3 259.3 216.9 352.1 466.6 486.1
      Lowest price PKR 155.6 159.4 114.0 152.0 265.2 379.9
      Break-up value PKR 459.3 298.2 240.8 253.9 235.3 219.1
      Price earning ratio (P/E) (x) 0.94 3.6 (11.5) 7.5 9.7 10.0
      Price to book Ratio (x) 0.1 0.3 0.2 0.2 0.4 0.5
      Dividend per share PKR 10.0 15.0 - 10.0 15.0 25.0
      Bonus share % - - - 20.0 20.0 20.0
      Dividend payout (including bonus) % 5.4 24.2 - 44.3 45.5 64.4
      Dividend yield (including bonus) % 5.8 6.7 - 7.1 5.3 7.0
      Dividend cover ratio (including bonus) (x) 18.4 4.1 - 2.3 2.8 2.5

      Analysis

      The variation in ratios as compared to FY 2021 is because of the following:

      • Price earning ratio has decreased due to decrease in market value per share by 23% whereas EPS has increased by 196%.

      • Breakup value of the company has improved due to profit retained during the year.

      • Decline in price to book ratio is primarily due to decline in market value per share by 23.4%

      • Dividend payout has decreased whereas the dividend cover has increased due to decline in cash dividend from Rs. 15 per share to Rs. 10 per share and increase in earnings from Rs. 62.1 per share to Rs. 183.7 per share.

    • Activity/Turnover Ratios
      2022 2021 2020 2019 2018 2017
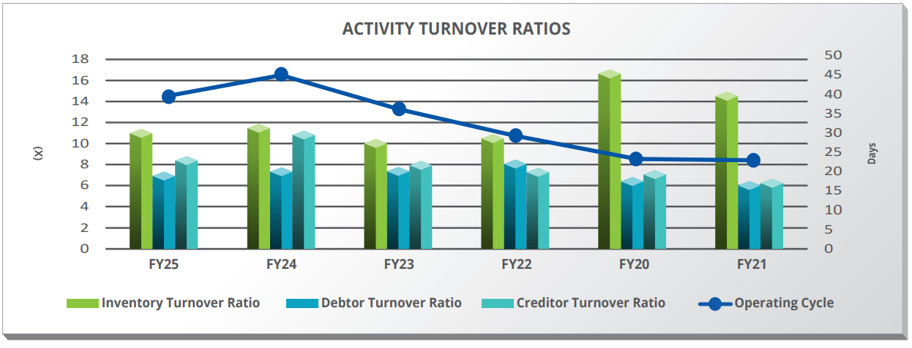
      Inventory turnover ratio (x) 10.89 16.88 14.93 13.06 13.84 14.36
      No. of days in inventory No 34.00 22.00 25.00 28.00 26.00 25.00
      Debtor turnover ratio (x) 12.43 6.83 6.25 5.77 5.73 5.61
      No. of days in receivables No. 30.00 54.00 58.00 63.00 64.00 65.00
      Creditor turnover ratio (x) 11.28 16.51 12.51 10.15 10.75 11.64
      No. of days in creditors No. 33.00 23.00 30.00 36.00 34.00 31.00
      Total asset turnover ratio (x) 4.22 3.94 3.43 3.27 3.30 2.98
      Fixed asset turnover ratio (x) 178.31 116.81 142.18 172.07 183.24 160.93
      Operating cycle No. 31.00 53.00 53.00 55.00 56.00 59.00

      Analysis

      The variation in ratios as compared to FY 2021 is because of the following:

      • Inventory turnover has decreased on account of increase in average inventory by 209% due to increase in international oil prices.

      • Debtors turnover has improved due to more proportionate increase in sales as compared to trade debts. During the year, gross revenue increased by 89.4% whereas average debtors increased by 56.0%.

      • Creditors turnover has decreased primarily due to increase in trade payables on account of increase in international oil prices.

      • Total asset turnover has improved due to more proportionate increase in sales than average total assets. Increase in sales is due to both positive volume and price variance.

      • Operating cycle has decreased primarily due to increase in creditor days on account of increase in trade payables and decrease in debtor days.

    • Employee Productivity Ratio
      2022 2021 2020 2019 2018 2017
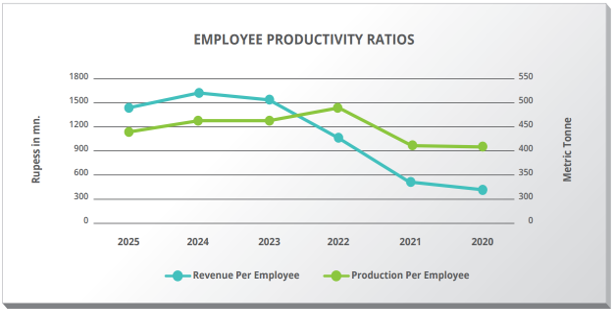
      *Production per Employee Metric Ton 484 416 411 412 467 447
      *Revenue per Employee PKR in Mn. 1,085 503 441 446 374 323
      Staff Turnover Ratio (x) 0.09 0.06 0.05 0.04 0.05 0.06

      *For consistency purposes, employees number for each year includes outsourced employees who were regularized in FY2018 & FY2019 in accordance with court rulings.

      Analysis

      The variation in ratios as compared to FY 2021 is because of the following:

      • Production per employee has increased mainly due to increase in the production of lube manufacturing plant of the company.

      • Revenue per employee has increased significantly on account of increase in sales of both white oil and black oil products due to rise in industry demand and focused sales strategies adopted by PSO as well as due to rising international pricing trend.

    • Non Financial Ratios
      2022 2021 2020 2019 2018 2017
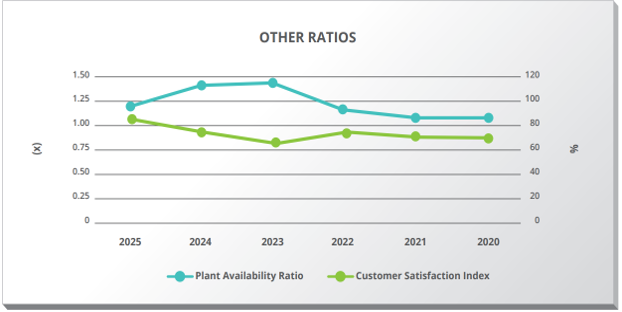
      Plant Availability Ratio % 1.23 1.16 1.16 1.14 1.08 1.08
      *Customer Satisfaction Index % 74 70 70 71 66 -

      *Customer responses are being formally monitored by company since FY 2018.

      Analysis

      The variation in ratios as compared to FY 2021 is because of the following:

      • Plant availability ratio has increased because actual production hours increased from planned production hours due to rise in sales demand.

      • Customer satisfaction index has increased due to PSO's continuous efforts on providing best customer services and satisfying customers’ needs.

    • Others
      2022 2021 2020 2019 2018 2017
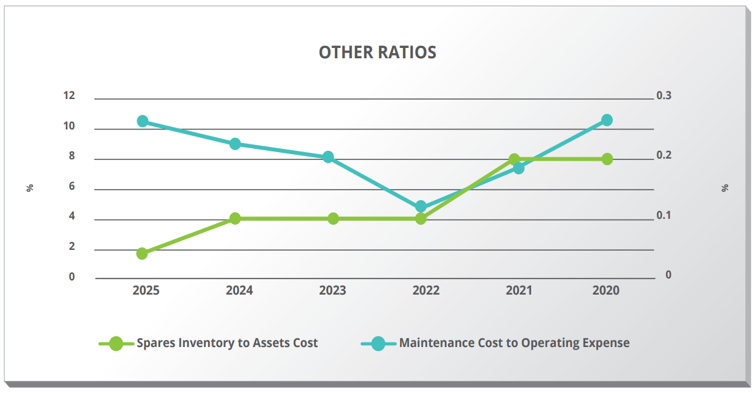
      Spares Inventory to Assets Cost Ratio % 0.1 0.2 0.2 0.1 0.1 0.1
      Maintenance Cost to Operating Expense Ratio % 4.7 7.3 10.6 6.1 6.3 7.4

      Analysis

      The variation in ratios as compared to FY 2021 is because of the following,

      • Spares inventory to assets cost ratio has decreased mainly due to increase in total assets by 137%. Moreover, stores, spares and loose tools has also decreased by 4%.

      • Maintenance cost to operating expense ratio has reduced due to increase in operating expenses of the company by 72% mainly due to increase in company's contribution towards workers' profit participation fund and workers' welfare fund on account of increase in profits.

  • Latest Announced Dividend Payment

    Books Closure Dates
    Rate From To
    Rs. 10/- per share October 19, 2022 October 26, 2022

    Dividends approved by BOM, are paid to shareholders on the basis of entitlement determined on book closure date. Shares must be purchased and duly registered before the book closure date to be entitled to receive the dividend.

    Dividends per share declared during last five years:

    Year Total Dividend Declared
    2022 100%
    2021 150%
    2020 -
    2019 120%
    2018 170%

Quick Links