Financials

    • Analysis of Financial Position

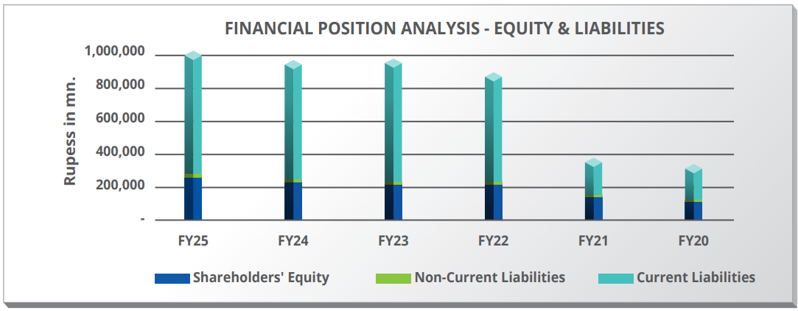
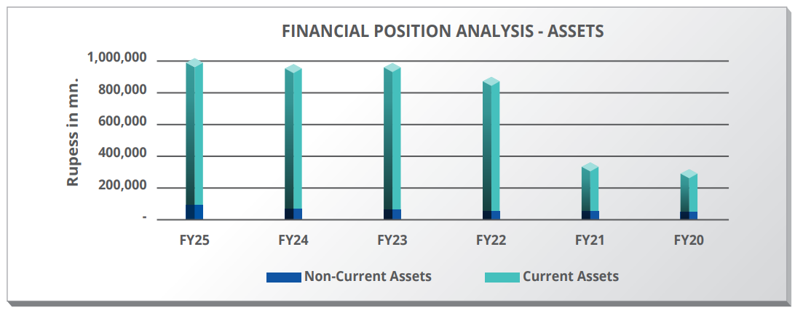
      Analysis of Financial Position

      For the year ended June 30, 2024

      Rupees In Millions
      2024 2023 2022 2021 2020 2019
      Shareholders' equity 231,309 216,560 215,649 139,978 113,061 119,181
      Non-current assets 68,126 60,047 53,624 51,297 49,611 32,854
      Current assets 906,322 923,349 845,830 327,962 293,261 384,225
      Non-current liabilities 18,001 18,491 16,548 12,239 12,461 7,528
      Current liabilities 725,139 748,345 667,258 227,043 217,350 290,371

      Analysis of Financial Position

      As of June 30, 2024, variation as compared to June 30, 2023 is as follows:

      • Shareholders' equity grew by approximately 6.82% compared to last year. This increase is led by rising retained earnings. The growth in equity strengthens the Company's financial foundation, depicting that it is generating sufficient returns and retaining earnings to support future growth.

      • The 13.45% increase in non-current assets for FY24 is driven by strategic investments in operating assets, subsidiaries, and an increase in the fair value of a significant long-term investment (PAPCO). These moves are indicative of the Company’s focus on long-term growth, diversification, and value enhancement. By strengthening its operational base and expanding through subsidiaries, the Company is positioning itself for sustained growth and improved financial performance in the future.

      • The slight reduction in current assets reflects deliberate and strategic financial management aimed at optimizing the Company's resources. By carefully deploying cash, improving receivables collection, and efficiently managing inventory, the Company is enhancing its liquidity and operational efficiency.

      • The 3.10% reduction in current liabilities underscores the Company’s commitment to effective debt management and financial optimization. By reducing short-term borrowings and managing interest costs through shorter tenure financing, the Company is enhancing its financial flexibility and reducing interest expenses.

      • Non-current liabilities decreased marginally by 2.64%. This decline is mainly attributed to the changes in retirement benefits liability computed through actuarial valuations.

    • Analysis of Financial Performance

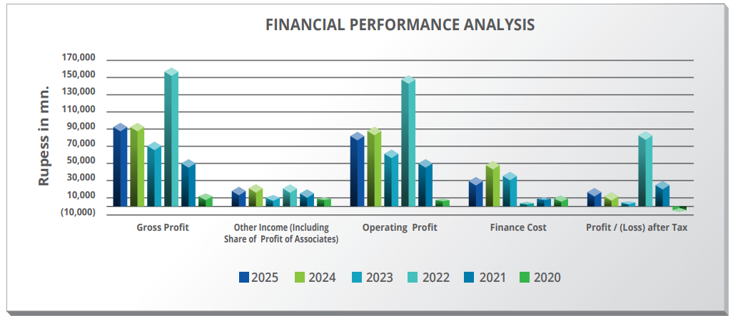
      Analysis of Financial Performance

      For the year ended June 30, 2024

      Rupees In Millions
      2024 2023 2022 2021 2020 2019
      Gross sales 3,806,811 3,605,464 2,697,061 1,424,249 1,302,037 1,340,978
      Net sales 3,571,750 3,391,112 2,451,581 1,204,247 1,108,358 1,154,298
      Gross profit 97,291 74,847 160,995 54,609 12,227 36,017
      Other income (including share of profit of associates) 25,187 12,648 25,507 19,408 10,755 7,559
      Marketing & Administrative Expenses 24,815 20,478 16,812 14,890 14,638 12,414
      Other expenses 3,908 2,317 17,114 4,829 51 4,699
      Operating profit 92,129 65,560 151,882 53,717 7,749 26,257
      Finance cost 52,338 40,335 4,721 10,242 13,427 8,987
      Profit / (Loss) before tax 41,417 24,366 147,855 44,056 (5,134) 17,477
      Profit / (Loss) after tax 15,863 5,662 86,223 29,139 (6,466) 10,587
      Earning before Interest, Taxes, Depreciation & Amortization (EBITDA) 97,458 67,601 154,819 56,053 9,907 27,591

      Analysis

      In FY24, Company has reported profit after tax of Rs. 15.9 bn. primarily on account of following elements:

      • The Company achieved a 5.6% increase in gross sales, reaching Rs. 3.8 trillion in FY24 compared to Rs. 3.6 trillion in FY23. This rise is mainly related to price variance.

      • Gross profit increased significantly by 30%, from Rs. 74.8 bn. in FY23 to Rs. 97.3 bn. in FY24. This increase is primarily attributable to enhanced margins in white oil segment

      • The Company reported a remarkable growth in other income, which rose to Rs. 25.2 bn. in FY24 from Rs. 12.6 bn. in FY23. This substantial increase was mainly driven by the recovery of financing costs associated with the white oil pipeline and higher income from deposit accounts, reflecting efficient financial management.

      • The operating profit increased by 40.5%, reaching Rs. 92.1 bn. in FY24 compared to Rs. 65.6 bn. in the previous year. This growth is a result of increase in gross margin, other income and Company's successful control over operating expenses relative to revenue growth.

      • The significant increase in finance costs during the current financial year is due to higher average borrowings in FY24 to finance receivables tied up in circular debt.

    • Analysis of Variation In Results Reported In Interim Reports

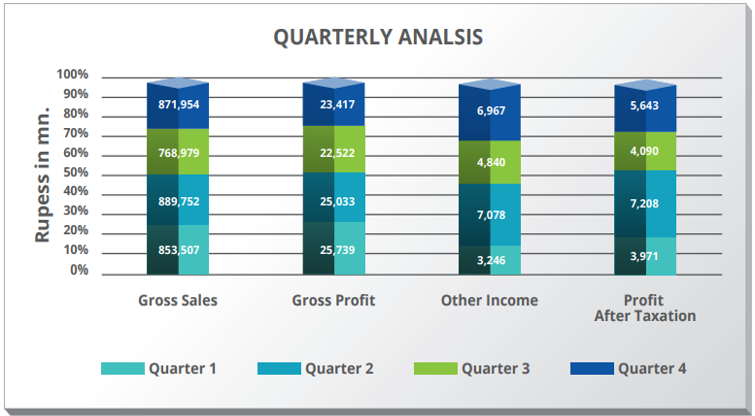
      Analysis of Variation In Results Reported In Interim Reports

      For the year ended June 30, 2024

      Rupees In Millions
      Q1 Q2 Q3 Q4 FY 2024
      Gross sales 976,155 954,995 908,260 967,401 3,806,811
      Gross profit 58,450 (3,229) 24,673 17,397 97,291
      Other income 3,348 7,761 2,181 10,272 23,561
      Operating cost (9,093) (6,089) (6,710) (6,830) (28,723)
      Finance cost (10,283) (15,086) (15,039) (11,930) (52,338)
      Share of profit / (loss) of associate - net of tax 441 328 294 562 1,626
      Profit / (loss) before taxation 42,863 (16,315) 5,399 9,470 41,417
      Taxation (20,975) 2,177 248 (7,005) (25,554)
      Profit / (Loss) after taxation 21,888 (14,138) 5,647 2,465 15,863
      • Gross Sales

        Gross sales was highest in first quarter due to higher sales volumes and prices.

      • Gross Profit

        Gross profit was highest is the first quarter due to higher sales volumes and favorable pricing regime.

      • Other income

        Other income was higher in second and last quarter due to recovery of financial charges pertaining to line fill cost.

      • Finance Cost

        Finance cost was higher in second and third quarter due to increase in average borrowings consequent to higher average receivables from SNGPL in these quarters.

      • Profit After Tax

        Profit after tax was highest in first quarter mainly due to higher gross profit and lower finance cost.

    • Summary of Cash Flow Statement

      Summary of Cash Flow Statement

      For the year ended June 30, 2023

      Rupees In Millions
      2024 2023 2022 2021 2020 2019
      Cash and cash equivalents at the beginning of the year 25,808 (12,061) (5,917) (881) (16,468) (7,925)
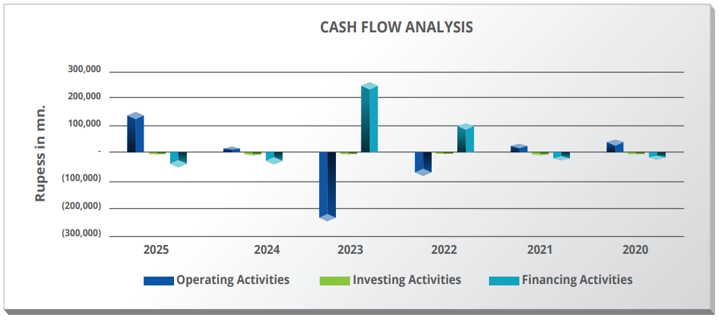
      Net Cash inflow / (outflow) from operating activities 13,707 (241,282) (80,974) 17,766 48,260 (9,232)
      Net Cash (outflow) / inflow from investing activities (7,550) (4,353) (2,090) (5,294) (4,843) (2,534)
      Net Cash (outflow) / inflow from financing activities (33,636) 259,382 101,042 (17,507) (27,830) 3,223
      (27,479) 13,748 17,977 (5,036) 15,587 (8,543)
      Cash and cash equivalents at the end of the year (1,671) 25,808 12,061 (5,917) (881) (16,468)
      • Analysis

        The cash flow statement over the past six years reveals fluctuations in the Company’s cash flows as follows:

      • Operating Activities

        The Company's operating cash flows were quite healthy in FY24 as compared to prior years .This aligns with the balance sheet's shift in trade debts and receivables, which were quite high in prior years and have reduced this year.

      • Investing Activities

        Negative cash flows from investing activities reflects ongoing investments in assets and strategic diversification initiatives being pursued by the Company. These investments underline the Company’s commitment to expanding its operational base and enhancing long-term growth prospects.

      • Financing Activities

        Cash flow from financing activities was negative in FY24 as Company's consistent pursuit for recovery resulted in reduction in receivables. This reduction provided some financial space to the Company for debt repayments.

    • Profitability Ratios
      2024 2023 2022 2021 2020 2019
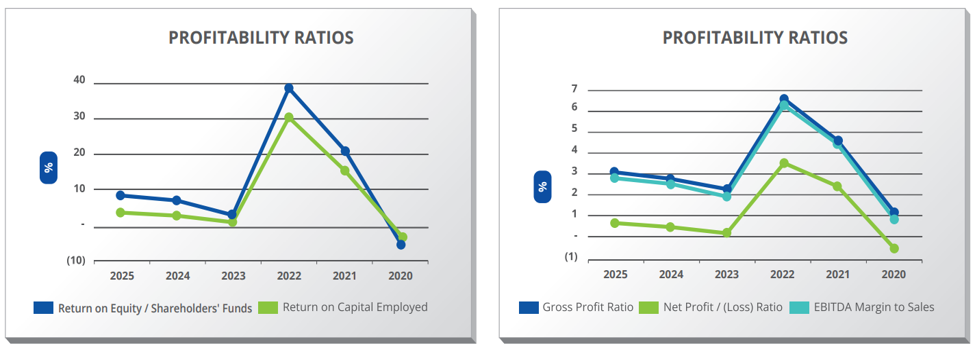
      Gross profit ratio % 2.72 2.21 6.57 4.53 1.10 3.12
      Net Profit / (Loss) ratio % 0.44 0.17 3.52 2.42 (0.58) 0.92
      EBITDA margin to sales % 2.73 1.99 6.32 4.65 0.89 2.39
      Return on shareholders' equity % 6.86 2.61 39.98 20.82 (5.72) 8.88
      Return on capital employed % 2.49 1.12 30.39 15.52 (3.19) 4.97
      Operating leverage ratio % 843.00 (150.28) 174.74 6,411.86 1,725.19 (211.76)
      Equity / Shareholders' Funds Rs. In Mn. 231,309 216,560 215,649 139,978 113,061 119,181
      Total Shareholder Return % 47.65 (31.27) (19.33) 47.49 (6.79) (32.38)

      Analysis

      As of June 30, 2024, variation as compared to June 30, 2023 is as follows:

      • Gross Profit Ratio & Net Profit Ratio

        The gross profit and net profit ratios improved during the year. This increase is primarily due to enhanced margins of white oil complemented by higher sales volumes of LNG, LPG and lubricants.

      • EBITDA Margin to Sales & Return on Shareholders' Equity

        The EBITDA margin to sales rose in FY24 which is indicative of stronger operational performance and better cost control. Return on Shareholders' Equity (ROE) also saw a significant increase, highlighting substantial improvement in earnings.

      • Return on Capital Employed & Operating Leverage Ratio

        Return on Capital Employed (ROCE) increased due to an increase in profitablity. The Operating Leverage Ratio in FY24 shows that Earnings before interest and tax increased substantially more in percentage terms over FY23 than respective change in sales.

      • Shareholders' Funds & Total Shareholder Return

        Shareholders' funds increased, signalling growth in the equity base. The Total Shareholder Return in FY24 also demonstrates substantial value creation in shareholders' returns.

    • Capital Structure Ratios
      2024 2023 2022 2021 2020 2019
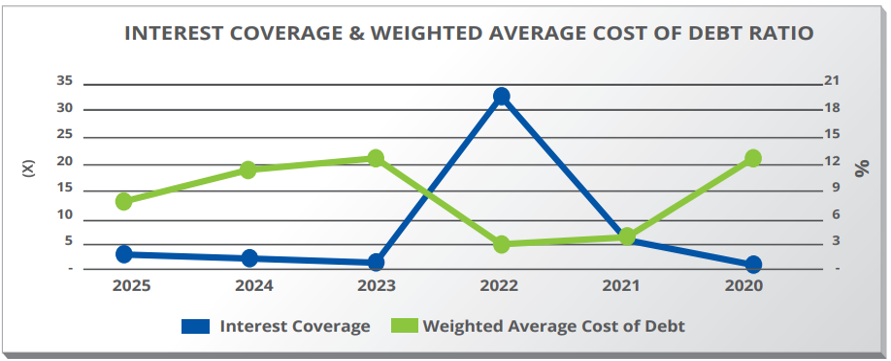
      Interest cover ratio (x) 1.79 1.60 32.32 5.30 0.62 2.94
      Net Assets per Share Rs. 492.70 461.28 459.34 298.16 240.83 253.86
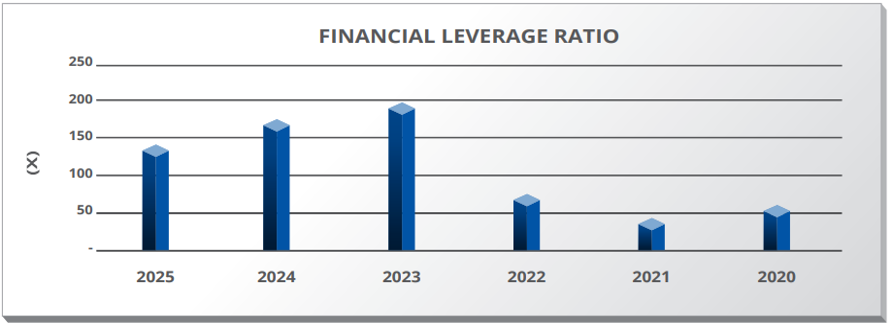
      Financial leverage ratio (x) 175.00 196.00 73.00 41.00 59.00 90.00
      Weighted average cost of debt % 11.31 12.97 3.01 3.69 13.19 18.44
      Economic value addition Rs. In Mn (18,617) (26,688) 27,261 10,292 (32,114) (14,962)

      Note: D/E ratio has not been calculated as the Company has no long term debt.

      Analysis

      As of June 30, 2024, variation as compared to June 30, 2023 is as follows:

      • The interest cover ratio improved in FY24 owing to stronger profitability in the current year.

      • The increase in net assets per share demonstrates a positive growth in shareholder equity. This rise is due to retained earnings and enhances financial stability and shareholders' value.

      • The decrease in the financial leverage ratio is due to repayment of debt during the year which also reduces financial risk for the Company.

      • The reduction in the weighted average cost of debt reflects more favourable borrowing terms and a shift towards less expensive debt in FY24

    • Liquidity Ratios

      Liquidity Ratios

      For the year ended June 30, 2023

      Rupees In Millions
      2024 2023 2022 2021 2020 2019
      Cash to current liabilities (x) (0.002) 0.03 0.02 (0.03) (0.004) (0.06)
      Cash Flow From Operating Activity (x) 0.02 (0.32) (0.12) 0.08 0.21 (0.04)
      Cash Flow from Operations to Sales (x) 0.004 (0.07) (0.03) 0.01 0.04 (0.01)
      Cash Flow to Capital Expenditure (x) (2.24) (47.40) (24.29) 3.19 16.04 4.66
      Cashflow Coverage Ratio (x) 0.03 (0.57) (0.52) 0.32 0.73 (5.31)
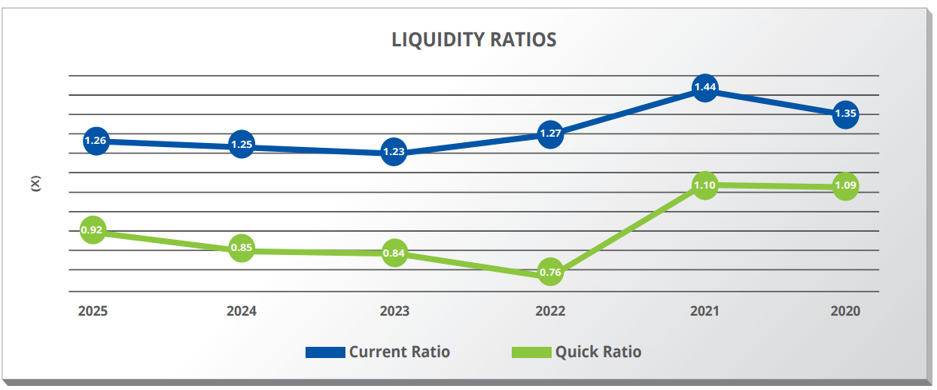
      Current Ratio (x) 1.22 1.23 1.27 1.44 1.35 1.32
      Quick Ratio (x) 0.83 0.84 0.76 1.10 1.09 1.01
      Free Cash Flows to the Company Rs. In Mn. 32,974 (237,104) (103,524) 6,117 66,161 (3,130)
      Free Cash Flows to the Equity Holders Rs. In Mn. (88,116) (20,698) (1,183) (13,124) 27,347 386

      Analysis

      As of June 30, 2024, variation as compared to June 30, 2023 is as follows:

      • In FY24, the cash to current liabilities ratio fell due to decrease in cash and cash equivalents at year end on account of repayment of short-term borrowings.

      • The positive cash flow from operating activities in 2024 is due to reduction in trade receivables and inventory levels.

      • The cash flow from operations to sales ratio as well as cash flow to capital expenditure improved due to increase in cash flow from operating activities.

      • The cash flow coverage ratio improved, indicating better coverage of cash obligations primarily due to a positive shift in the operating cashflows as compared to last year. The current ratio and the quick ratio remained stable reflecting availability of adequate liquidity to the Company.

      • The positive Free Cash Flows to the Company showcases a strong financial performance, where the Company generated sufficient cash from its operations to cover its capital expenditures and investments.

      • The reduction in Free Cash Flow to Equity holders is primarily attributable to debt repayments and increased interest expenses.

    • Investment Ratios
      2024 2023 2022 2021 2020 2019
      Earning / (Loss) per share (basic & diluted) Rs 33.79 12.06 183.66 62.07 (13.77) 22.55
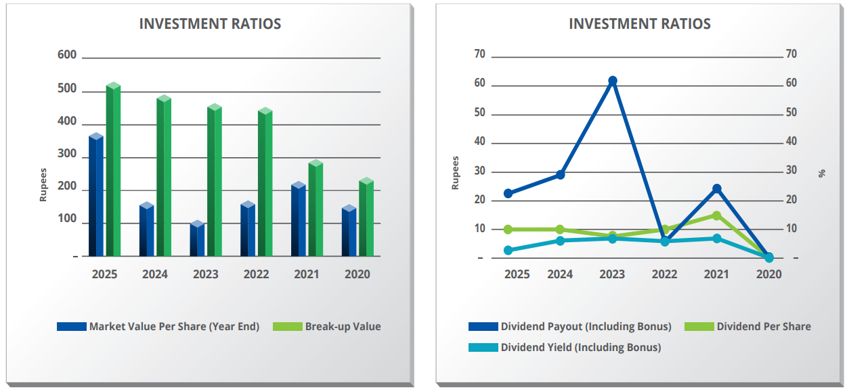
      Market value per share (Year End) Rs 166.21 111.01 171.84 224.25 158.20 169.63
      Highest price Rs 217.22 192.82 231.30 259.32 216.90 352.13
      Lowest price Rs 109.96 99.03 155.63 159.35 114.00 151.96
      Break-up value Rs 492.70 461.28 459.34 298.16 240.83 253.86
      Price earning ratio (P/E) (x) 4.92 9.20 0.94 3.61 (11.49) 7.52
      Price to book Ratio (x) 0.08 0.05 0.09 0.28 0.22 0.19
      Dividend per share PKR 10.00 7.50 10.00 15.00 - 10.00
      Bonus share % - - - - - 20.00
      Dividend payout (including bonus) % 29.60 62.19 5.44 24.17 - 44.35
      Dividend yield (including bonus) % 6.02 6.76 5.82 6.69 - 7.07
      Dividend cover ratio (including bonus) (x) 3.38 1.61 18.37 4.14 - 2.25

      Analysis

      As of June 30, 2024, variation as compared to June 30, 2023 is as follows:

      • Earnings per Share (EPS) & Market Value per Share

        EPS surged to Rs. 33.79 in FY24 from Rs. 12.06, signalling robust profitability and operational success. This positive performance boosted the market value per share to Rs. 166.21, reflecting increased investor’s confidence.

      • Price-to-Earnings (P/E) & Price-to-Book Ratios

        A lower P/E ratio of 4.92 in FY24, down from 9.20, highlights the Company's attractive valuation, with strong earnings potential. The low Price-to-Book ratio of 0.08 suggests that the stock is undervalued.

      • Dividend Analysis

        With an increased dividend per share of Rs. 10.00 and a stronger dividend cover ratio of 3.38, PSO demonstrates a solid balance between rewarding shareholders and reinvesting for future growth, underscoring its commitment to long-term value creation.

    • Activity/Turnover Ratios
      2024 2023 2022 2021 2020 2019
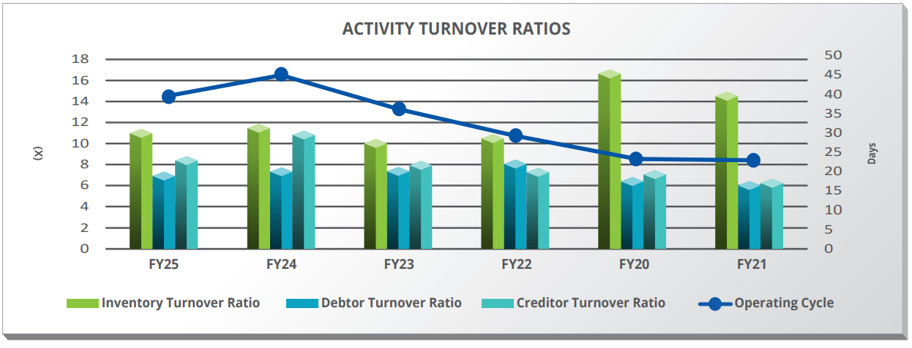
      Inventory turnover ratio (x) 11.95 10.46 10.89 16.88 14.93 13.06
      No. of days in inventory Days 31.00 35.00 34.00 22.00 25.00 28.00
      Debtor turnover ratio (x) 7.74 7.78 8.28 6.83 6.25 5.77
      No. of days in receivables Days 48.00 47.00 45.00 54.00 58.00 63.00
      Creditor turnover ratio (x) 11.23 12.36 11.28 16.51 12.51 10.15
      No. of days in creditors Days 33.00 30.00 33.00 23.00 30.00 36.00
      Total asset turnover ratio (x) 3.89 3.83 4.22 3.94 3.43 3.27
      Fixed asset turnover ratio (x) 184.24 207.09 178.31 116.81 142.18 172.07
      Operating cycle Days 46.00 52.00 46.00 53.00 53.00 55.00

      Analysis

      As of June 30, 2024, variation as compared to June 30, 2023 is as follows:

      • PSO’s improved inventory turnover ratio in FY24 and reduced number of days in inventory are due to its ability to optimize stock levels, respond to market demands effectively, enhancing liquidity and reducing holding costs.

      • The slight reduction in debtor turnover ratio in FY24 is mainly due to the increase in average debtors owing to an increase in receivables balance from SNGPL. Receivables from SNGPL, however, started decreasing towards the end of the year.

      • The reduction in the creditor turnover ratio, alongside the increase in the number of days in creditors resulted in optimization of cash flows and thus liquidity of the Company.

      • The reduction in the operating cycle from 52 days in FY23 to 46 days in FY24 is a positive indicator of improved operational efficiency. By shortening the time taken to convert inventory and receivables into cash, PSO has strengthened its liquidity position, which is crucial given the substantial short-term borrowings (Rs. 403.6 bn. in FY24) and the liquidity crunch it faces due to the circular debt. The ability to cycle cash faster allows PSO to better manage its significant current liabilities and maintain operational stability.

      • The asset turnover ratio improved slightly, indicating that the Company generated more sales per unit of assets. The marginal increase indicates that PSO is utilizing its assets more effectively to generate revenue, a positive sign for ongoing operational efficiency.

    • Employee Productivity Ratio
      2024 2023 2022 2021 2020 2019
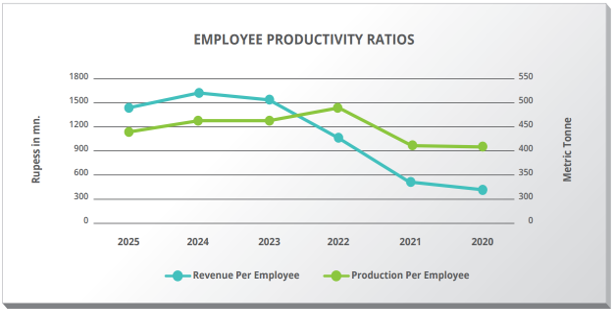
      Production per Employee Metric Ton 461 461 484 416 411 412
      Revenue per Employee PKR in Mn. 1,619 1,526 1,085 503 441 446
      Staff Turnover Ratio (x) 0.07 0.05 0.06 0.06 0.05 0.04

      Analysis

      As of June 30, 2024, variation as compared to June 30, 2023 is as follows:

      • Production per employee has remained stable.

      • Revenue per employee has increased significantly. This increase is a combination of operational efficiency as well as increase in market prices of petroleum products.

    • Non Financial Ratios
      2024 2023 2022 2021 2020 2019
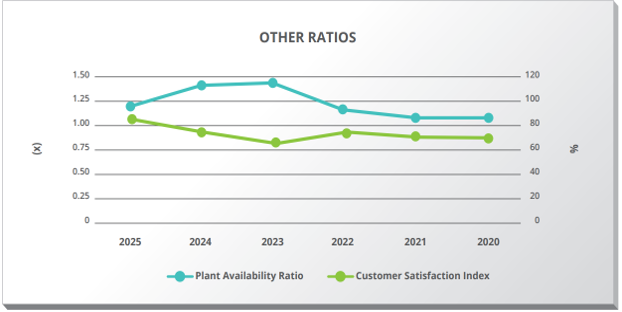
      Plant Availability Ratio (x) 1.39 1.40 1.23 1.16 1.16 1.14
      Customer Satisfaction Index % 74 62 74 70 70 71

      Analysis

      As of June 30, 2024, variation as compared to June 30, 2023 is as follows:

      • Plant availability ratio has remained stable.

      • Customer satisfaction index is monitored based on customer responses.

    • Others
      2024 2023 2022 2021 2020 2019
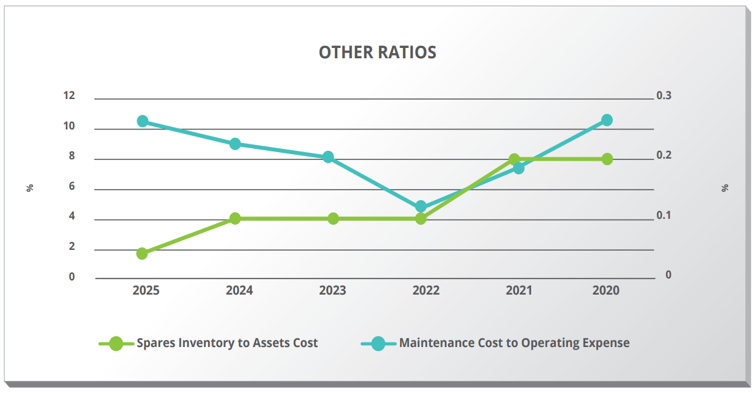
      Spares Inventory to Assets Cost Ratio % 0.1 0.1 0.1 0.2 0.2 0.1
      Maintenance Cost to Operating Expense Ratio % 9.0 8.1 4.7 7.3 10.6 6.1

      Analysis

      As of June 30, 2024, variation as compared to June 30, 2023 is as follows:

      • Spare Inventory to asset cost has remained stable.

      • Maintenance cost to operating expenses has increased this year on account of various budgeted maintenance activities undertaken this year.

  • Latest Announced Dividend Payment

    Books Closure Dates
    Rate From To
    Rs. 10/- per share October 17, 2024 October 24, 2024

    Dividends approved by BOM, are paid to shareholders on the basis of entitlement determined on book closure date. Shares must be purchased and duly registered before the book closure date to be entitled to receive the dividend.

    Dividends per share declared during last five years:

    Year Total Dividend Declared
    2024 100%
    2023 75%
    2022 100%
    2021 150%
    2020 -
    • Statement of Corporate Intent

Quick Links